UCITS ETF (Ticker M9SV)
Background
The Market Access STOXX China A Minimum Variance Index UCITS ETF (M9SV) was first listed in Europe in June 2018 and cross listed on London Stock Exchange in April 2020.
The ETF tracks the performance of the Stoxx® China A 900 Minimum Variance Unconstrained AM (Accessible Market) Index (China A Minimum Variance Index).
It is a CNY denominated index of onshore-listed China A shares that selects its constituents from the STOXX China A 900 Index with the aim of reducing volatility.
The unique feature of the Unconstrained methodology is that the index minimises volatility but is not restricted to follow its benchmark too closely. Unlike other low volatility or minimum variance indices, whose compositions are typically only allowed to differ from their benchmark by up to 5% or 10%. Such constrained indices only provide a tilt towards the low volatility or minimum variance factor, whereas the Unconstrained index provides undiluted minimum variance exposure.
The China A Minimum Variance Index is calculated on a net total return basis, meaning that it factors in dividends paid by index constituents net of any applicable withholding tax.
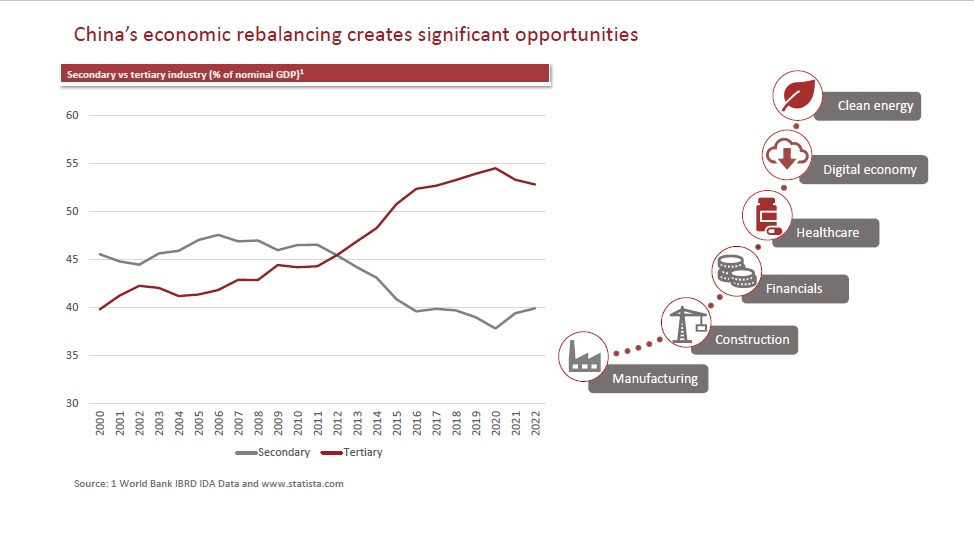
Why China?
- Second largest economy in the world, growing at an average rate of 9% over the twenty years to 20201
- A growing domestic consumer base, which is very tech savvy and tuned into the latest consumer trends
- In 2000, China’s middle class amounted to just 3% of its population. By 2018, this was over 50% (707 million people)2
- Economic transformation in China is seeing an ongoing shift from industry to services, and also from construction and related sectors to higher end manufacturing subsectors like car and train production and computer and telecommunications equipment
Source: 1 The World Bank IBRD IDA Data, 2 Center for Strategic and International Studies “How well-off is China’s middle class?”, September 2021
Why a minimum variance approach to investing in Chinese equities?
China presents a potentially significant investment opportunity, but has been heavily under-represented in many western portfolios as investors are wary of drawdown risks.
Using mean variance, the optimal portfolio weights are selected by minimising the volatility of individual stocks and correlations with other constituents. A minimum variance portfolio is therefore the portfolio with the lowest overall risk and possibility of drawdowns.
The STOXX® China A 900 Minimum Variance Unconstrained AM Index was developed to provide a minimum variance portfolio of China A Shares with the lowest overall volatility.
The STOXX® China A 900 Minimum Variance Unconstrained AM Index is not an index that aims to select low volatility stocks. Its aim is to minimise the overall portfolio volatility at index level. The process typically favours low risk stocks and sectors, therefore capturing the low volatility factor.
Source: Market Access AM Ltd and Bloomberg, data as at 31 March 2025. Past performance should not be used as an indicator of future performance
Performance
Source: Market Access AM Ltd and Bloomberg, as at 31 March 2025. Past performance should not be used as an indicator of future performance
Source: Market Access AM Ltd and Bloomberg, as at 31 March 2025. Past performance should not be used as an indicator of future performance
5 Year returns to 31 March 2025 (in GBP)
| STOXX® China A 900 MV Unconstrained AM (SA9CUNAC) | CSI 300 (CSIN0300) | MSCI China A Onshore (M7CN1A) | FTSE China A50 (XINA50NC) | |
|---|---|---|---|---|
| Period return | 56.16% | 10.40% | 11.46% | 13.23% |
| Annualised return | 9.31% | 2.00% | 2.19% | 2.51% |
| Annualised volatility | 15.12% | 19.30% | 19.37% | 20.44% |
| Maximum drawdown | 15.46% | 42.91% | 42.08% | 43.51% |
| Sharpe ratio | 0.45 | -0.03 | -0.02 | 0.00 |
Source: Market Access AM Ltd and Bloomberg, as at 31 March 2025. SONIA interest rate benchmark (SONIO/N index) used to calculate Sharpe ratios. Past performance should not be used as an indicator of future performance
Discrete annual performance to 31 March 2025 (in GBP)
| Mar 20 - Mar 21 | Mar 21 - Mar 22 | Mar 22 - Mar 23 | Mar 23 - Mar 24 | Mar 24 - Mar 25 | |
|---|---|---|---|---|---|
| STOXX® China A 900 MV Unconstrained AM (SA9CUNAC) | 29.11% | -1.21% | 5.33% | 3.92% | 11.84% |
| CSI 300 (CSIN0300) | 36.27% | -7.95% | -3.71% | -17.40% | 10.66% |
| MSCI China A Onshore (M7CN1A) | 35.06% | -3.57% | -3.63% | -19.61% | 10.47% |
| FTSE China A50 (XINA50NC) | 36.98% | -12.07% | -3.12% | -12.80% | 11.29% |
| FTSE All-Share (ASXTR) | 26.71% | 13.03% | 2.92% | 8.43% | 10.46% |
| S&P 500 (SPTR500N) | 40.17% | 20.81% | -2.24% | 26.33% | 5.36% |
| MSCI Emerging Markets (NDUEEGF) | 42.72% | -7.01% | -4.90% | 5.40% | 5.92% |
Source: Market Access AM Ltd and Bloomberg. Past performance should not be used as an indicator of future performance
Market drawdowns: Performance of Stoxx® China A 900 Minimum Variance Unconstrained AM Index (in GBP)
| Drawdown Period | STOXX® China A 900 MV Unconstrained AM | CSI 300 | MSCI China A Onshore | FTSE China A50 |
|---|---|---|---|---|
| January 2018 to February 2019 | 23.26% | 30.03% | 35.19% | 30.95% |
| Reason for market drawdown - Slowing economic growth and US trade tariffs | ||||
| January 2021 to June 2022 | 12.30% | 28.56% | 26.59% | 30.95% |
| Reason for market drawdown - Technology crackdown, real estate crisis and Covid 19 lockdowns | ||||
Source: Market Access AM Ltd and Bloomberg. Past performance should not be used as an indicator of future performance
China A Minimum Variance Index - Top 10 holdings (as at 31 March 2025)
| SECURITY_NAME | ICB Supersector | Weight |
|---|---|---|
| China Yangtze Power Co Ltd | Utilities | 5.79% |
| Beijing-Shanghai High Speed Railway Co Ltd | Industrial Goods and Services | 4.00% |
| Daqin Railway Co Ltd | Industrial Goods and Services | 3.37% |
| China United Network Communications Co Ltd | Telecommunications | 3.29% |
| Agricultural Bank of China Ltd | Banks | 3.22% |
| Industrial & Commercial Bank of China Ltd | Banks | 3.05% |
| Bank of China Ltd | Banks | 2.99% |
| Fuyao Glass Industry Group Co Ltd | Industrial Goods and Services | 2.85% |
| China Petroleum & Chemical Corp | Energy | 2.25% |
| Sichuan Chuantou Energy Co Ltd | Utilities | 2.16% |
Source: Stoxx
China A Minimum Variance Index constituents and key ratios (at 31 March 2025)
| Number of constituents | 138 |
| P/E ratio | 13.76 |
| Dividend yield (net) | 4.16% |
| Debt/Equity | 0.96 |
| Price/Book ratio | 1.56 |
Source: Stoxx and Bloomberg
Source: STOXX, Bloomberg, Market Access AM Ltd at 31 March 2025, using ICB Supersector classifications
Fund documentation
|
Factsheet
|
|
|
KIID
|
|
|
Market Access Prospectus December 2021
|
|
|
UK Reporting Fund Status
|
|
|
PRIIPS KID
|
|
How to invest
Please contact your wealth management adviser or stockbroker. The ETF is also available through leading online investment platforms. The ETF is ISA and SIPP eligible.
Please contact us if there any issues with trading the ETF through a platform and we will gladly try to assist.
To find out more, please click here for fund information and literature.
Please read the prospectus, including the risk factors, and KIID before making an investment in the ETF.
Click here to find out more about Market Access.
key features
| Legal form | UCITS ETF |
| ISIN | LU1750178011 |
| TER / OCF | 0.45% |
| Domicile | Luxembourg |
| Management Company | FundRock Management Company S.A. |
| Investment Manager | Market Access Asset management Limited |
| Custodian and Administrator | CACEIS Investor Services Bank S.A.. |
| Replication | Physical |
| ISA / SIPP eligible | Yes |
| UK Reporting Fund Status | Yes |